21-Jul-2026: My original Excel-based VBA program will remain here for use in perpetuity. However, I will no longer update it. It has been superseded by my free, far more capable, multi-platform program:
Do you have a GRT EFIS (and/or Garmin/Dynon/AFS)? I have a GRT. These EFISs record a lot of data but we don't have good tools
available to view those data, especially for GRT. To that end, I have
created a comprehensive and very simple to use Microsoft Excel-based
flight data log display tool. It fully processes GRT LOG and CSV files as well as Garmin, Dynon and AFS CSV files (Seattle Avionics' FlyQ EFT XML files also supported). It creates animated KML files for viewing your flight (and other aircraft around you) in 3D in Google Earth.
My program is public domain. You have full access to the VBA code. The program does not use the cloud. You don't need to upload your valuable flight data to someone else to analyze it. All of your data stay with you. It provides complete privacy when viewing and analyzing your flight data.
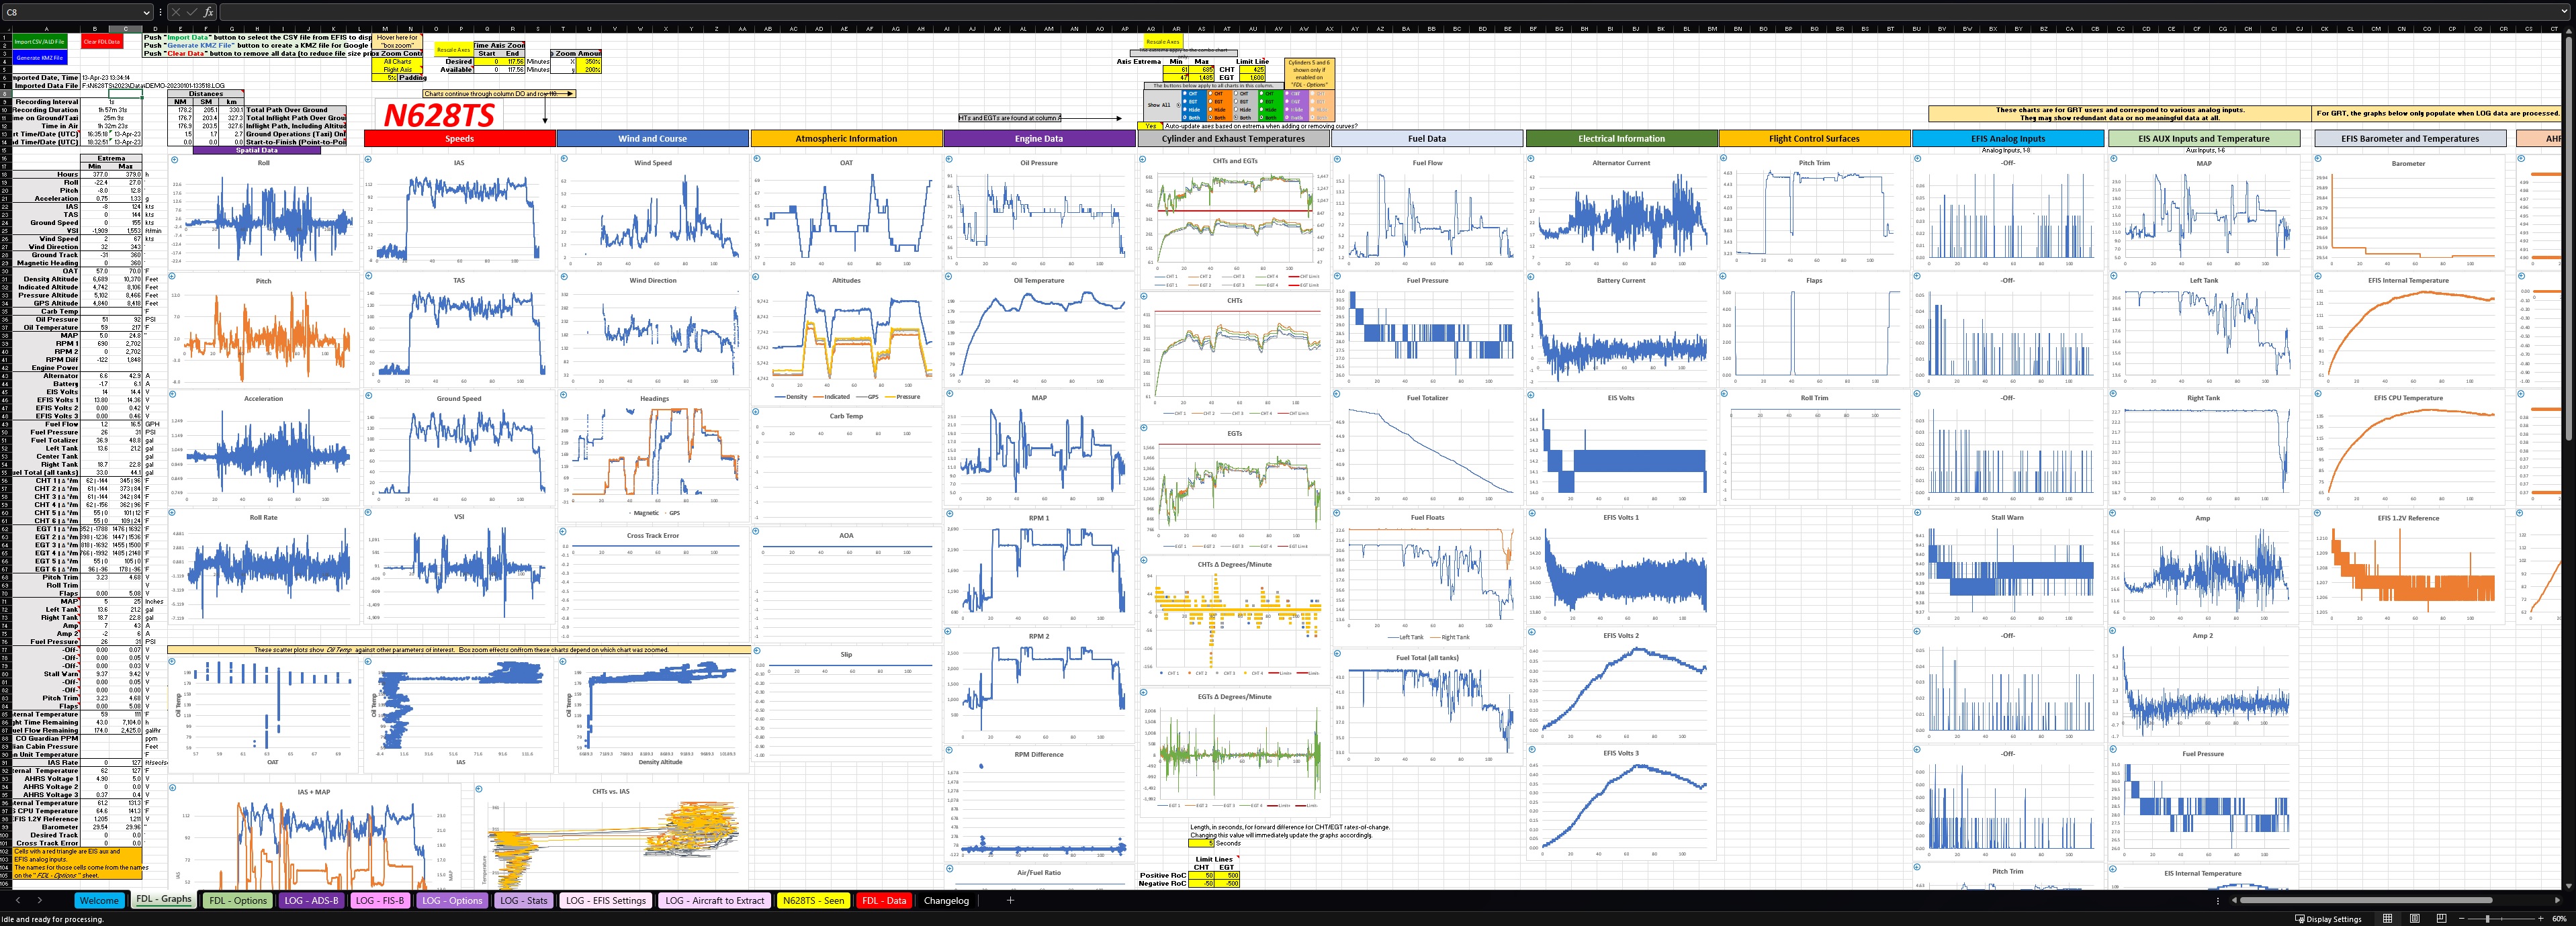
Here is an example of the extended of data you can view with this program with GRT LOG files, GRT/Garmin/Dynon/AFS CSV files and FlyQ EFT XML files. Continue reading to see the program's full capabilities.
Download the latest version (6.1) here (use the download icon in the upper right after clicking on the latest link below). If you can't find how to download the file, then please read the previous sentence again :)
Note: The program only runs on Excel. Porting the code to LibreCalc or OpenOffice is probably not practical.
GRT users: Add a full suite of voice alerts to your EFIS! Learn how to customize your own too.
- Completely new program released 21-Jul-26: Please see my free, new, much more capable, multi-platform program: "E's Flight Data Analysis Tool"
- No more development 18-Jul-26: I will leave my Excel-based VBA program available for download however I don't anticipate developing it further. See link below to download it.
- Version 6.1 released 27-Apr-26.
- GRT Update:
- Analog input information pulled from LOG files correctly.
- Dynon updates:
- The list of flights contained in the file now includes the duration.
- Will help the user choose the flight of interest and avoid choosing recordings that are probably not associated with flights.
- Bug fixes (see Changelog sheet).
- Version 6.0 released 1-Dec-24.
- Waypoint and flight plan generator added. See tab "WP & FltPln".
- GRT Updates:
- When processing LOG files, Stratux status data extracted and presented.
- Stats are found on tab "LOG - Stats".
- Graphs are found furthest right on tab "FDL - Graphs".
- Added option to remove GPS data when flagged as inaccurate.
- Note: KMZ file will connect valid points together, dismissing invalid points. This behavior will be changed in a future version by creating a collection of separate KML files in the KMZ file.
- Added Ford Trimotor silhouette. Delete your silhouettes folder to get the updated set.
- Dynon update:
- Reduced time threshold for multiple flight detection.
- Bug fixes (see Changelog sheet).
- Version 5.91 released 19-Apr-24.
- Bug fix (see Changelog sheet).
- Version 5.9 released 12-Mar-24.
- Little bug fixes (see Changelog sheet).
- Version 5.81 released 12-Nov-23.
- Little bug fixes (see Changelog sheet).
- Version 5.8 released 17-Jul-23.
- Several bug fixes (see Changelog sheet).
- GRT Updates:
- Analog input decoding support added to Sport/Horizon 10.1 LOG files.
- For "basic engine option" models, OAT, OilP, OilT and Tach may not be correct scaling. If you have this option on your EFIS, please send me some LOG files to work with.
- Garmin update:
- They recently added some new fields to their CSV files that broke my program. Fixed.
- Version 5.7 released 16-Apr-23.
- Lots of bug fixes (see Changelog sheet).
- GRT updates:
- When processing LOG files, Settings and States are now captured to a new "LOG - EFIS Settings" sheet.
- Settings and States can be exported to associated ".bak" files to upload to the EFIS to later restore previously used settings.
- When settings are changed in flight, this is tracked.
- ADS-B processing: Added 7 new silhouettes.
- Delete your Silhouettes folder to get the new set.
- When processing LOG files, flight data are now extracted even if AHRS data are not available.
- Can decode SBS data from dump1090-based receivers.
- Jump to the bottom to see list of changes for previous revisions.
Late 2019, I released my GRT (and later, Garmin) flight data logging (FDL) analysis tool that would take the CSV file
recorded from flight, calculate some statistics, graph various
parameters and plot your flight in Google Earth. Below is an old view from the original tool.
You can plot your flight in Google Earth and view flight data at any time/location.
It includes a "virtual pilot" view so you can
watch your flight in Google Earth, rewind, fast-forward, pause, etc., complete with a wind vector representation and a ground course
indicator. Example flight over the Sierra Nevadas and Lake Tahoe (from a GRT CSV file).
Here's a 4.5-hour flight from 03PR to KEIK compressed to 4 minutes. Again, note the flight director crosshairs and wind vector indicator (from a Garmin CSV file).
If you're into aerobatics, here are two aileron rolls (from a Garmin CSV file).
Nearby airports can be pointed out along your flight path.
When you click on airports, you get an info box that has a VFR chart snippet.
Now, only for GRT users, this is where
it gets really fun. We all recall that we can record our flight
using a "demo recording", for later playback on any GRT EFIS. In those LOG files
are all the data from among everything else, all serial port inputs. Thus, a nearly
complete capture of flight data is retained in the LOG files.
GRT kindly provides the format of those
binary files. The files can include data from your
ADS-B receiver (Stratux, SkyRadar or any GDL90 compliant device like
the GTX-345), should you have it connected to your EFIS. So the demo
files have a full record of every ADS-B packet received during your
flight. Which means that you can visualize other aircraft with Google Earth and rewind, fast-forward, pause, etc. Let's take a look at what we can see.
First, you get a lot more parameters to view. You can zoom in on any single graph or all graphs with a click-and-zoom function with multi-level unzoom.
When processing LOG files, a list of what devices are connected to your EFIS, what the analog inputs are defined as, what the serial port and EIS setups are and the amount of data each device transmitted to your EFIS is provided.
This includes a list of the LOG files processed with the amount of flight time contained in each and the amount of time it took your EFIS to write each LOG file.
All EFIS settings are captured in the LOG files and can be extracted. Settings that change mid-flight are tracked. These settings can be exported to a .bak file to later directly upload to your EFIS. Thus settings can be extracted from any LOG file, should you forget to make a backup through the EFIS menu.
If you have an ADS-B receiver on board, you can get a list of all aircraft in the sky during your flight. A full list is constructed including callsign, registration, type,
manufacturer, owner, etc. and can include highly accurate silhouettes of each aicraft based on its manufacturer and type.
All
aircraft flight paths can be rendered in Google Earth at the click of a button. Here are two examples from
KDEN. Red is a descending flight path, green is ascending.
KDEN Traffic 0436 - 1800 UTC.
KDEN Traffic 1800 - 0441 UTC.
Here's
an example from very late at night through to in the morning, showing the
flight paths of mainly cargo aircraft and passenger transcons.
Front Range, CO traffic 0436-1300 UTC.
You
can click on any aircraft and get a plethora of data about it,
including its past flights, owner, type, etc. and even an actual
picture of that specific aircraft uniquely determined by its
registration. Many aircraft are accurately represented by the more than 30 icons I include.
You can simply get a handle on how many planes are in the sky during your
flight. You can have specific aircraft icons be red based on model (e.g., all RVs can be red), manufacturer, owner, etc.
Surface position reports are decoded so you can view aircraft taxi and other ground vehicle movements.
You
can animate your flight with all other aircraft in the sky.
“Ownship” is always the green RV icon. Here's a flight from KMCK
to KOIN.
In addition to viewing other aircraft from your GRT EFIS' LOG file ADS-B data, you can independently look at data from any Beast Raw (dump1090-based receivers such as FlightAware,
FlightRadar24, ADSBx, etc.) or GDL90 source (e.g., Stratux). Here's a nearly 24-hour animation of aircraft along the Front Range starting at 0436 UTC and ending at about 0400 UTC the next day.
You
can click on any aircraft to see its ADS-B report at that time.
Or, you can take the perspective of your cockpit and see the other
aircraft flying around you, like this:
Or,
you can select any aircraft and hop in to their cockpit to see the
situation from their view.
You
can even project current FAA charts on to the terrain.
In all cases, you can either use Google Earth's terrain or project any FAA aviation chart onto the terrain
instead (e.g., VFR, IFR high/low, etc.).
Here is an example of the silhouette display on the list of aircraft identified by your ADS-B receiver. You can also see the number of times each aircraft has been tracked by your receiver, with the last date seen.
Clicking on the last date seen list each date that the aircraft was identified.
Comprehensive ADS-B statistics are provided.
Airports along your flight path can have FIS-B weather (METARs, SPECIs and/or NOTAMs) listed on the airport info box.
The ADS-B ground-based transceivers (a.k.a., "towers") that provided data to you on your flight are plotted in red.
Example of FIS-B data (shown here formatted differently than in the program).
The program is
quite quick on a modern computer. When processing ADS-B data, GDL90 data is faster to process
than raw ADS-B data (e.g., from SkyRadar). Though dependent on the
number of aircraft in the sky with you and/or how much data you choose to process, to give you an idea of
processing time, my 2017 i7-8700 computer can process an hour of
SkyRadar data in 1 minute. An hour of GDL90 data processes in less than a
minute. Older computers or those with a hard drive (rather than a
solid state drive) will be slower.
GDL90 data sources restrict the radius
of reported aircraft (to accommodate the typically slower serial connection into the EFIS). The
SkyRadar passes all data regardless of distance so you will
see far more aircraft with a SkyRadar than a GDL90 source. I have
run both simultaneously on the same flight and though the SkyRadar
sees more, they generally see the same aircraft in your immediate
vicinity.
What's required to use it:
-
Google Earth (only if you want to look at your flight path and/or ADS-B tracks, not necessary to see flight and engine data)
For ADS-B analysis (not required if you
don't plan to do ADS-B analysis):
- Three separate
aircraft databases that are freely available and are automatically
downloaded. Uses 800 MB of disk space for initial setup, then approximately 400 MB afterwards.
- SQLlite database query support for
Excel via freely available database engine that is easily installed.
How to use it:
FDL: Record your flight data as
explained in your EFIS manual. These files are in CSV format. I
suggest 400 ms recording interval for GRT. I don't have a Garmin or
Dynon, so I don't know if you can change that interval.
LOG: Record your demo LOG files
in flight as explained in your GRT EFIS manual. These files have a
.LOG extension. This is only available to GRT users.
Install Google Earth on your
computer from http://www.google.com/earth
-
You will need to "Enable
Content" when the security warning for the active content
appears.
Because the it uses VBA code, some antivirus programs may prevent you from running the program (
see here for explanation from Microsoft). You may have to adjust your
Trust Center settings to allow the program to be run.
Read the instructions on the
“Welcome” sheet. You built a kit plane so I know you can read
the instructions :)
This program represents several hundred hours of development time by me. I am not a professional programmer. The program surely has bugs. If you find a bug, send me your CSV/LOG file(s) and the spreadsheet you used plus information describing the issue. My contact information is on the spreadsheet.
Here's a mostly-complete accounting of
the features of this tool.
FDL Functions
- More than 88 engine and flight parameters available for
plotting and viewing.
- Each graph is one-click
zoomable with user-defined zoom scales.
- Extrema of all parameters
shown.
- Times on ground and in air
calculated.
- Integrated UTC offset to set displayed times to local.
- Nearly all parameters have user-defined names, units
and significant digits.
- Complete instructions provided on spreadsheet,
including how to setup your GRT EFIS to record flight data.
- Two separate and independent zooming features:
- One click, immediate zoom, using a plus symbol in the upper left of every chart.
- Box zoom feature: Draw a box around the data you want to zoom in on.
- Zoom can apply to selected chart or all charts.
- Idefinite multi-level zoom and unzoom.
- Plots all data or, to focus on a particular portion of
a flight, only a specific time period.
- AFS and Dynon users can select single flight if data has more than one.
- KMZ file, for integration into Google Earth,
automatically generated.
- 74 selectable engine
parameters and flight data shown at each point on the 3D map, including
distance and time to next plotted point.
- All points can be plotted or
- Four optional user-selectable
thresholds to control which points to plot.
- Plotting at user-defined
epochs (e.g., every 30 seconds)
- Lines colored according to user-defined
flight status parameters (ground, climb or descend).
- Aircraft registration, flight
time and date integrated into route names to manage multiple saved
flights in Google Earth.
- Airplane icon points in
direction of magnetic heading.
- Click on any location to get
selected flight and engine data.
- Each point labeled with the
time using user's UTC offset.
- Google
Earth lets you:
- Plot multiple flights.
- Animate your flight path.
- View flight paths in 3
dimensions from any angle.
- View engine and flight data
specific to aircraft position.
- Have far greater positional
resolution than FR24 and FlightAware KML files, and includes flight and
engine data.
- Plot against recent
geo-referenced charts on the terrain (e.g., VFR, IFR, TAC, etc.)
rather than satellite imagery.
- Animate wind vector and
speed indication.
- Animate ground track
indicator.
- "Virtual pilot"
mode lets you view your flight as though you were back in your
aircraft.
- Create a high quality
rendered video of your flight for off-line viewing.
- Airports along your flightpath can be plotted based on a worldwide database of nearly 42,000 airports.
- Airport info boxes include FAA VFR chart of airport area.
- Available METARs/SPECIs and NOTAMs are included in the airport info box when FIS-B data have been processed.
LOG/Demo Files Functions
- Select up to 32 additional parameters for plotting and
viewing that are not available in the FDL CSV files, such as
- CO Guardian PPM, temperature and pressure
altitude.
- AHRS, EIS and EFIS internal
temperatures and voltages.
- IAS rate of change, roll rate
and barometer setting.
- View higher resolution AHRS and EIS data than available
in the FDL CSV files.
- List of LOG files analyzed provided, including
- Corresponding start and end times and ticks, duration of file and time for EFIS to flush file (which represents duration of missing data).
- Lists all sources of data found.
- Lists serial port configuration.
- Extract all EFIS settings and states
- Export settings to a file for later import into the EFIS.
- Track settings change during a flight.
- View higher resolution AHRS and EIS data than available in the FDL CSV files.
- Extract ASCII and hexadecimal data from any serial
input into a separate file.
- For ADS-B in equipped aircraft
- Comprehensive statistics on what has been received.
- ADS-B: Number of targets, ground vehicles, position reports, etc.
- FIS-B: Number of weather products received, broken down by type (METAR, NOTAMs, etc.).
- Number of transmitter towers and type (high, low, surface, etc.).
- Extract FIS-B text-based weather products into a new sheet and optionally, save to a new file.
- METARs, NOTAMs, TAFs, PIREPs, NOTAMs, SUAs, AIRMETs, SIGMETS, Winds Aloft and CWAs.
- Visualize all aircraft around
you in Google
Earth.
- Use any combination of
terrain viewing.
- Or place geo-referenced
charts on the terrain (e.g., VFR, IFR, TAC, etc.) rather than
satellite imagery.
- Select and order the text
fields displayed next to icons
- Callsign, owner,
registration, ICAO, type, manufacturer and/or country.
- View locations of ADS-B ground based receivers (i.e., towers).
- Extract aircraft from the data
- Full list of extracted aircraft
provided.
- Sort based on callsign,
registration, ICAO address, position reports, flight distance, emitter
category, type, manufacturer, country of registration.
- Links to FAA registration,
flight history, aircraft type images and owner provided.
- Extract all aircraft or
select aircraft by
- Radial distance from
ownship.
- Callsign
- Minimum number of received
position reports
- Extract only certain time
period or from entire data set
- Extracted aircraft can be shown with a red icon in Google Earth
- Identifies aircraft on FAA's
blocked list.
- Export list to CSV file.
- List of aircraft are
alphabetized by selected field in Google Earth
- Callsign, owner,
registration, ICAO, type, manufacturer or country
- Aircraft
list includes accurate silhouette of aircraft type.
- Map
of aircraft to-silhouette can be exported and imported to support
updates to the mapping.
- Automatically
create a list of aircraft for which a silhouette could not be
resolved.
- This
list can be used to manually update the mapping.
- Automatically
create a master database of all aircraft identified by ADS-B.
- Count
number of unique dates each aircraft was found (a "hit").
- Track
dates of each "hit".
- Single-click
access to all dates any aircraft was identified.
- Independent
master databases for each aircraft you fly (based on its
registration). Useful if you fly
more than one aircraft.
- A
new yellow tab is maintained to show the records in the master database.
- Each
aircraft you fly gets its own tab.
- Animate movement of all
aircraft
- Sliders move time forward and
back
- Animate in real-time or sped
up as desired
- Pause at any time and move
viewing perspective as desired
- View the theater from any
perspective:
- Overhead
- Virtual pilot's view from
your aircraft.
- Virtual pilot's view from
any other aircraft.
- Any arbitrary location.
- Single-click access and simple portability: Output is a single KMZ file with all necessary data for Google Earth.
- Unique icons represent aircraft
type
- Specify size of icons
- Icons point in direction of
heading
- Specific type icons
- Douglas/McDonnell Douglas
DC-10/MD-11
- Airbus A380, A350, A340,
A330, A321/320/A319/A318, A300/310
- Boeing 737, 747, 747, 757,
767, 777, 787
- Most Bombardier aircraft
- Cessna jets
- Embraer ERJ-135/145 and
EMB-17x series
- Cirrus SR series
- Van's series
- Aerobatic
- Balloon and blimp
- Drone
- Glider
- Helicopter
- Ultralight
- Ground vehicle
- Parachute
- Twin prop
- Four prop
- Space vehicle
- Selectable text fields follow
each aircraft
- Select any aircraft extracted
and "fly" from its perspective.
- Create a high quality rendered video any aircraft's flight for off-line viewing.
- Click on any aircraft to view:
- Callsign
- Registration
- Type
- Manufacturer
- Country of registration
- Actual photo
- Owner
- Links to historical flights
and FAA registration
- Select/deselect flight-path
lines for any aircraft.
- Click on any location along
the flight path for detailed information
- Altitude, speed, track, time,
VSI, heading, emitter category, NIC, NACp, priority and misc data
- Flight-path lines colorized
according to selectable VSI rates
- Red is descending
- Green is climbing
- Automatically downloads FAA
and community-created aircraft databases.
- Watch status of program via
meaningful updates.
- In Excel's status bar and a
dedicated window on each page.
- Statistics are updated during
processing.
- Final statistics provided
following processing.
- Option to record all aircraft identified during your flight into a master database.
- Allows you to maintain a record of all aircraft that were flying at the same time that you were.
- A separate database is maintained for each aircraft you might be flying.
- For advanced users (not
related to data from GRT EFISs so most folks won't use these
capabilities).
List of updates from previous revisions:
- Version 5.6 released 4-Feb-22.
- GRT
- Can now determine and enumerate all EFIS analog input settings.
- This information is placed on "LOG - Stats" and "FDL - Options" sheets.
- For ADS-B data processing
- Added more than 300 new silhouettes.
- Delete your Silhouettes folder to get the new set.
- Updated silhouette mapping.
- Fixed some analog calculation errors.
- Revisit the "Analog Input References Setup" area on "LOG - Options" sheet.
- Fixed EFIS case and internal CPU temperature calculations.
- FlyQ EFT
- Added support for this EFIS' XML files (file suffix ".gpx").
- All Users
- Lots of bug fixes (see Changelog sheet).
- Added ability to update Virtual Radar Server's "AircraftOnlineLookupCache.sqb" database with current FAA database.
- Only useful if you run VRS. It's not related to EFIS data, so probably I'm the only one who'll use it.
- Version 5.5 released 10-Jan-21.
- Minor bug fixes and improvements (see Changelog sheet).
- Added support for Garmin G5 CSV files (including multi-flight support).
- Version 5.4 released 4-Jan-21.
- Support added for Garmin's most recent changes in the G3X's CSV file heading names.
- Version 5.31 released 1-Jan-21.
- Minor bug fixes (see Changelog sheet).
- Version 5.3 released 23-Dec-20.
- All users:
- Graphs now have a "click-and-zoom" function so you can zoom in on data.
- Includes multi-level unzoom.
- Zoom can apply to all graphs or just one.
- Added pressure altitude and CHT/EGT rate-of-change graphs.
- CHT and EGT graphs are more functional:
- One click add/remove cylinders from graphs and selectable limit lines.
- Graphs are better organized.
- GRT Users:
- You can now process LOG files from multiple flights for unattended processing. Each flight will generate its own saved spreadsheet(s) and/or KMZ file(s) to view after batch processing is completed.
- ADS-B processing:
- Additional silhouettes mapped.
- One-click enable/disable dialog boxes.
- Various other bug fixes (see Changelog sheet).
- Version 5.2 released 2-Nov-20.
- "Blocked" aircraft list enumeration restored (I broke it in v5.0).
- FAA N-number query from the LOG - ADS-B sheet is restored (it broke due to FAA changing their webpage recently).
- Additional silhouettes mapped
- Version 5.13 released 30-Oct-20.
- Minor bug fix for GPS interpolation.
- Version 5.12 released 24-Oct-20.
- Additional silhouettes mapped.
- Database comparison function considers image URL lookup date.
- Minor bug fix for GPS interpolation.
- Version 5.11 released 18-Oct-20.
- Additional silhouettes mapped.
- Fixed things for Dynon users (see Changelog sheet).
- Version 5.1 released 06-Oct-20.
- Couple of little bug fixes (see Changelog sheet).
- ~1,500 additional silhouettes mapped (based on most prevalent aircraft from U.S. FAA database).
- Version 5.03 released 20-Sep-20.
- For the master database, image URLs received from image server now include the date of receipt.
- When
updating image URLs, that date is compared against today's date, rather
than last date of flight, to determine if the image server should be
consulted for an updated image.
- Fixed a bug in the GPS data interpolation routine that was inadvertently introduced in v5.02.
- Version 5.02 released 17-Sep-20.
- Several bug fixes (see Changelog sheet).
- Larger silhouette map.
- Two new silhouettes (delete your Silhouettes folder to get new silhouettes to extract automatically).
- Version 5.01 released 8-Sep-20.
- Fixes for minor bugs that most people probably weren't subject to (see Changelog sheet).
- Silhouette map expanded.
- Version 5.0 released 2-Sep-20.
- Usual myriad of bug, stability and speed improvements (see Changelog sheet).
- For
Garmin, Dynon, AFS and GRT users, airports along your flightpath can be
plotted in Google Earth based on a worldwide database of nearly 42,000
airports.
- The info box for these airports include a nice popup VFR chart snippet.
- GRT users:
- ADS-B
- Processing improvements. 2.5x times faster processing!
- FIS-B
text weather products are extracted and enumerated. You can now see
all METARs, TFRs, PIREPs, Winds aloft, TAFs, CWAs, etc. from your flight
and even automatically save that information to a separate file (see
image below).
- You can choose which targets to process (ADS-B and/or TIS-B only).
- For non-GDL90 users,
- UAT
targets are now processed, including anonymous targets and TIS-B
targets! This means that targets are now classified by their source and
ID on the aircraft list: ADS-B, TIS-B, self-assigned, etc.
- Aircraft
category encoding is complete so you can get the full range (surface
vehicle, glider, etc.). This was already complete for GDL90 sources.
- More silhouettes can be matched to the aircraft type.
- Ground transceivers (a.k.a., "towers") received during your flight are plotted at their locations with a red tower icon
- Actual aircraft image URL
- URL to actual aircraft image is now saved in the master database.
- This link is provided on the aircraft list and in the Google Earth KMZ file.
- You can automatically process your master database to update the URLs.
- Changes in KMZ file for Google Earth
- Includes locations of all TIS-B/FIS-B ground-based transceivers received with tower icon.
- Airports
nearby your flight path can be plotted with a VFR chart snippet of the
field and all received METARs, SPECISs and NOTAMs listed for each in a
nice tidy popup info box.
- Includes aircraft-type specific silhouette in info box.
- You
can flag other RVs or any other aircraft (based on several available
criteria) with a red icon (e.g., all UAL flights, Pilatuses and/or just
all King Airs from only the Air Force, etc.).
- Master
database now saves the aircraft image URL and only updates it if it's
more than a year old. This speeds up processing and reduces traffic to
the image server.
- Comprehensive statistics on ADS-B stats to include number of type of reports (TIS-B, FIS-B) and list of FIS-B products received.
- Kind reminders when your aircraft registration databases are getting stale.
- New "stats" page
- Shows which devices are connected to your EFIS.
- Serial port setup.
- How much data each device sent.
- The various types and numbers of ADS-B and FIS-B data, etc.
- If you click anywhere inside the spreadsheet, you're given the option to stop processing.
- TAS and DA calculations have been improved and now essentially match those shown on your EFIS.
- "Beast" (dump1090-type) and GDL90 (raw data from Stratux) binary users:
- The various ADS-B processing improvements for the GRT LOG files have been incorporated into these binary formats too.
- Version 4.1 released 1-Jul-20.
- Usual myriad of bug, stability and speed improvements (see Changlog sheet).
- GRT users:
- LOG files:
- Wind vector thresholds available to suppress calculation of the vector (e.g., during aerobatics or high rate-of-change maneuvers).
- List
of LOG files processed provided, including start, end and duration
times including how long it took the EFIS to flush each file
(representing missing flight data).
- ADS-B:
- Can now decode ADS-B surface position reports so you can see aircraft and vehicles move on the ground.
- Can
sort by callsign for those aircraft whose callsign is an N-number.
This will favor putting private, U.S.-registered aircraft at the top of
the list so you don't have a bunch of Boeings and Airbuses at the top.
- Master database:
- Added editing features.
- Can import master databases so you can share and compare among friends.
- You
can now compare two or more master databases to find aircraft common to
them. This lets you determine if two different airplanes you fly or
databases between friends have seen ADS-B reports from the same
aircraft.
- LOG and CSV files :
- Data smoothing available for analog and EIS aux inputs (useful for noisy inputs like fuel floats and Hall effect sensors).
- Non-GRT users:
- All users:
- Distance calculation also shown in km.
- Version 4.0 released 9-Jun-20.
- A myriad of bug, stability and speed improvements (see Changlog sheet).
- LOG functions:
- Automatically create a master database of all aircraft identified by ADS-B.
- Count number of unique dates each aircraft was found (a "hit").
- Track dates of each "hit"
- Single click access to all dates any aircraft was identified (see example at the bottom of this post).
- Independent master databases for each aircraft you fly.
- A new yellow tabbed sheet is maintained to show the records in the master database.
- Each aircraft you fly gets its own tab.
- Aircraft list includes accurate silhouette of aircraft type (see example at the bottom of this post).
- The aircraft-to-silhouette mapping can be exported and imported to support updates to the mapping.
- Magnetic variation is calculated using the IGRF model.
- Allows wind vector to be now calculated under all conditions.
- Analog input decoding now supported for HXr, HX, Horizon HS and Horizon WS.
- Version 3.1 released 3-May-20.
- LOG functions:
- Tighter handling of various GPS types and any misalignment between ADS-B source time and GPS source time.
- Other minor improvements (see Changlog sheet).
- A full accounting of all the changes are found on the "Changelog" sheet.
- Version 3.0 released 2-May-20.
- FDL functions:
- Squashed bugs (see Changlog sheet).
- Code optimization yielding speed improvements.
- Added status bar updates.
- Added lots more parameters from GRT LOG/demo data.
- KMZ output
- Added animation and tour to KMZ output, including "virtual pilot" mode.
- Includes wind vector and flight director.
- Added network-linked FAA charts to KMZ.
- Added Dynon support for CSV files.
- LOG functions:


